Female Royal Society URFs: Why so Few?
Earlier this week, the Royal Society announced the recipients of its University Research Fellowship (URF) awards for 2014. A URF fellowship is a highly presitigious award and a key stepping stone for young academics embarking on an independent research career. Of the 43 awards made this year, only two -- less than five percent -- went to women.
The Royal Society was understandably somewhat concerned by this. The issue has been discussed in the national news and the blogosphere. The current president of the Society, Nobel Prize-winning geneticist Paul Nurse, has written a blog post, detailing the statistics for the last five years and announcing an investigaion into why so few awards were made to female researchers this year. The numbers used here are taken from that post.
Initial data looked very bad for the Royal Society. Since 2010, the fraction of awards given to women has only declined, from 33% in 2010, to 4.6% in 2015:
Helpfully, the Royal Society have also published statistics for each stage of the URF application process, so we can dig deeper into this disappointing decline and understand why the number of women this year was particularly low.
My initial thought was that the proportion of women among those who applied for the award had simply declined. The Royal Society offers several other fellowships to young researchers. Perhaps female researchers had applied to these fellowships instead and so the fraction of female applicants was just less this year.
A quick plot of the data tells us that this is not the case. The fraction of female applicants has remained broadly stable over the last five years, with female researchers comprising approximately 20% of applicants, with no discernable decline this year:
So what has happened? Looking at the numbers in more detail we can calculate a simple success probability at each stage in the application process as follows:
For example, the interview success probability for women in 2013 is:
Plotting these values for both female and male applicants across all five years for each stage in the application process gives us the following graph:
Now we see a key point of interest. The success probability for women in 2014 was lower at every stage in the process that in 2013 and was in fact either the lowest or second lowest value observed over all five years. This is surprising.
Without more data, it's difficult to be sure what has happened here, but we can make some speculative suggestions.
Firstly, it could be pure chance. A "blip".
Secondly, the female applicants this year could have been unusually weak, so were more likely to be eliminated at all stages of the application process.
Thirdly, there was a strucutral or systematic bias that disadvantaged female applicants. As David Sumpter describes, a small, insignificant bias at each stage can lead to a statistically significant change in the proportions of successful male and female applicants.
To try and understand which (if any) of these options is responsible for this year's figures, I simulated some URF applicants and put them through a thre-stage selection process. The simulation code is available on github, but basically, what it does is this:
- Simulate 396 applicants (this is the number of applicants in 2014);
- Each applicant is given a basic ability (how good their science is), by drawing from a gaussian distribution;
- Each applicant is then given a performance score at each stage, by using this basic ability as the mean of another gaussian distribution;
- Each candidate is given a gender: female or not female, in a proportion that reflects the fraction of female applicants in 2014;
- Order the candidates by their shortlisting score and select the top x percent, where x is the (total, non-genedered) success probability at that stage (using the mean value across all five years of data);
- Re-order and re-select the remaining candidates based on interview and award scores;
- Finally, look at the number of female candidates receiving an award.
I ran this simulation 1000 times and extracted the number of women made an award. The distribution of awards made to women is shown below:
As you can see, having only two female award winners is a pretty unusual event. Out of 1000 simulations, only 25 resulted in two or fewer awards made to women. So if URFs are being awarded fairly and the proportion of female applicants doesn't change, we would expect two or fewer female URFs in only 25 years of the next millenium. Let's forget about blips then.
Secondly, we have the "weaker applicants" hypothesis. Did women simply submit poorer applications this year? I introduced a bias term to the model, to reduce the scores of female candidates and repeated the simulation to see how large a difference in score is needed to recreate this year's gender balance. It turns out that the answer is "not much". Once the difference in score between men and women is similar in magnitude to the variance, almost no women are selected at all:
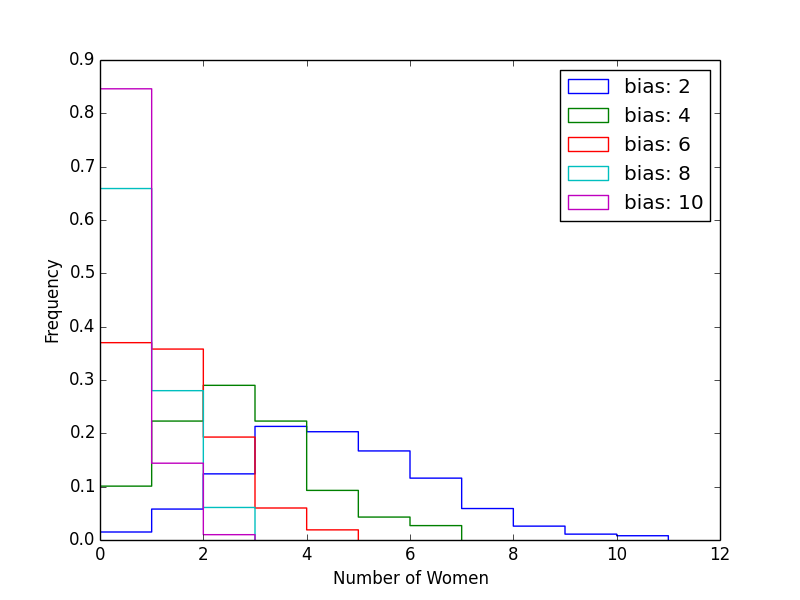
Unfortunately, this effect is indistinguishable from hypothesis three, that this year's selection process introduced a systematic bias against female candidates. The outcome of either process is the same: women are ranked lower and eliminated earlier -- either because their applications are genuinely of lower quality, or because the selection process unfairly scored them lower.
Without additional information about the applicants and the application process, we cannot decide which (if either) of these explanations is correct. We can only hope that this is something that can be explained by the Royal Society investigation.
EDIT: Julia Higgins, interviewed on BBC Radio 4's Inside Science suggests that female applicants this year were on average younger than their male counterparts. This could have created a difference in the perceived quality of their applications, as certain quality metrics, such as raw numbers of publications and citations, increase with time. If this age difference was only observed in 2014, it could be wholly or partially responsible for the higher elimination rate of female candidates at all stages of the application process.